Basics
The whole idea first, then the terms the rest of this page uses.
1.1Whole idea
A React Native app has a JavaScript heap, a native heap, and objects that connect the two. A listener that JavaScript never removes can keep a native object alive, and that object keeps a whole screen alive. The telltale sign is memory that climbs one step each time you visit a screen, even after a garbage collection.
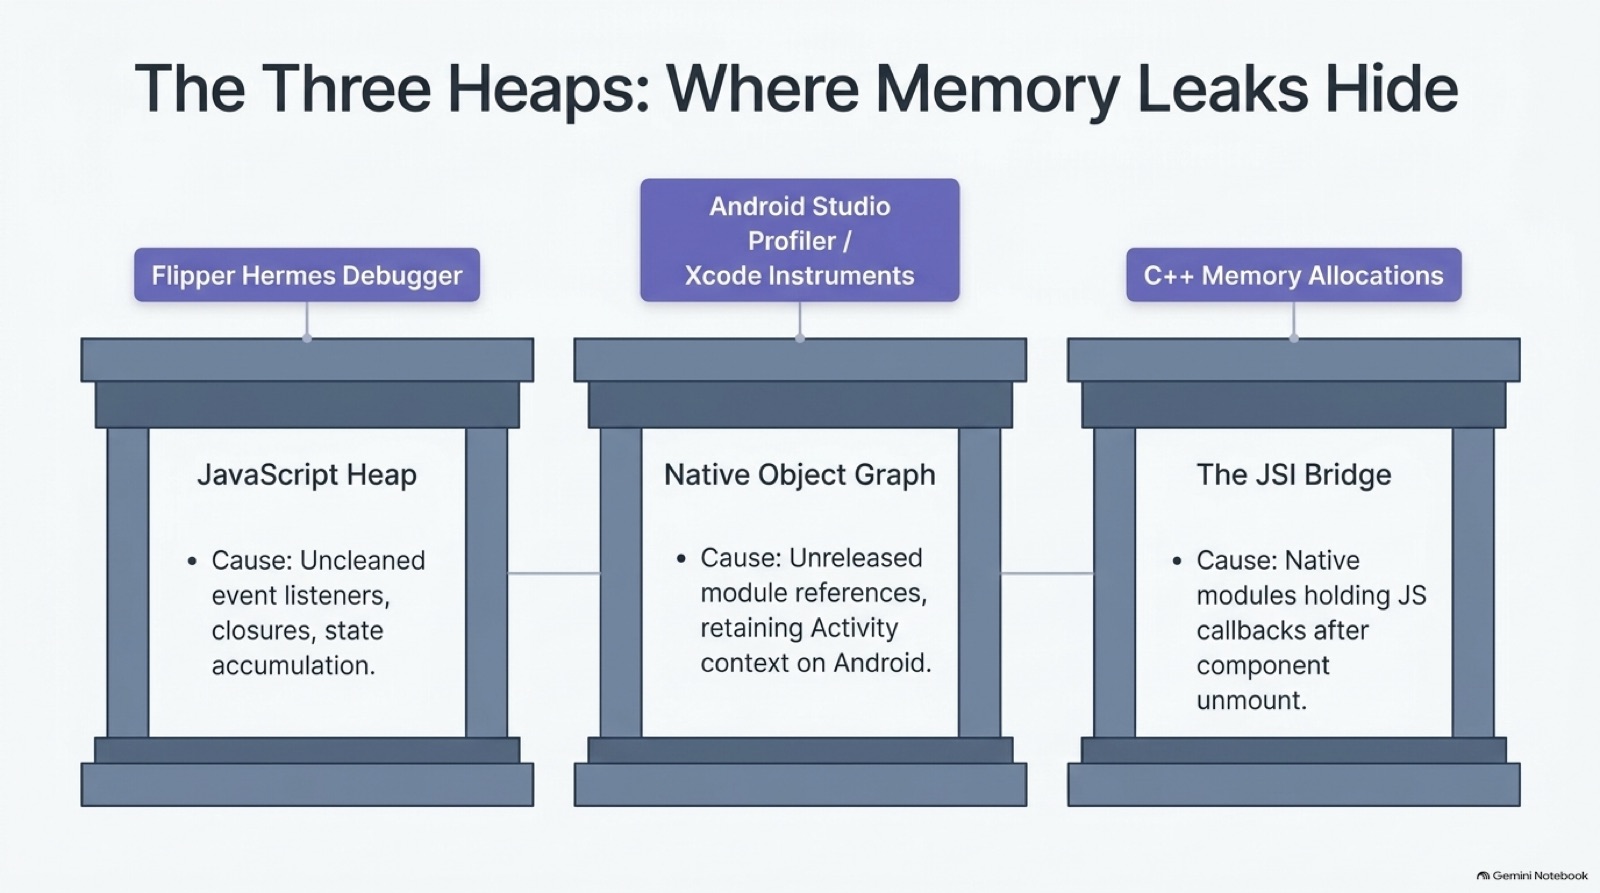
A leak can hide in the JavaScript heap, the native heap or the boundary between them, and each needs a different tool.
1.2Key concepts
One idea per card, in plain words.
Objects in the Hermes engine. Leaks here come from listeners, timers and closures that nothing removes.
Java, Kotlin, Swift and C++ objects. A static reference to an Activity or view controller keeps its whole screen alive.
Host objects that link the two. A leak on either side can stop the other side from being freed.
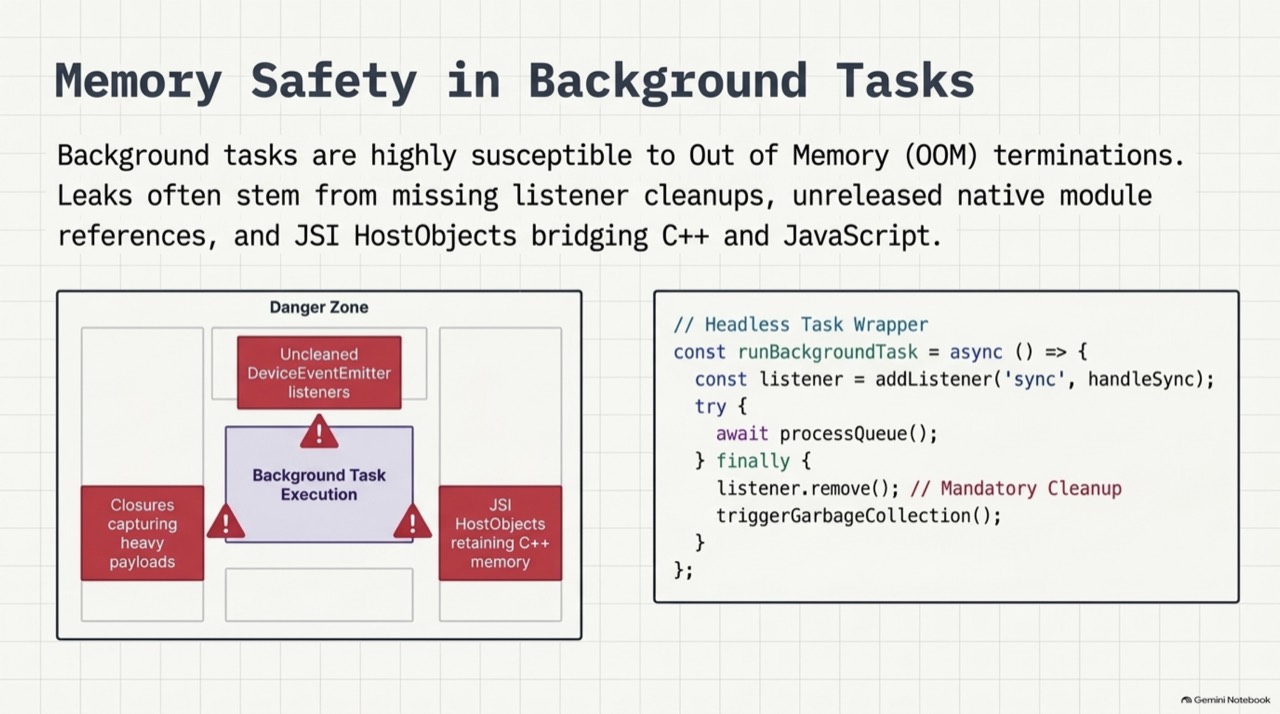
A function that keeps the variables it uses alive. A listener holding a closure over a large payload keeps the payload.
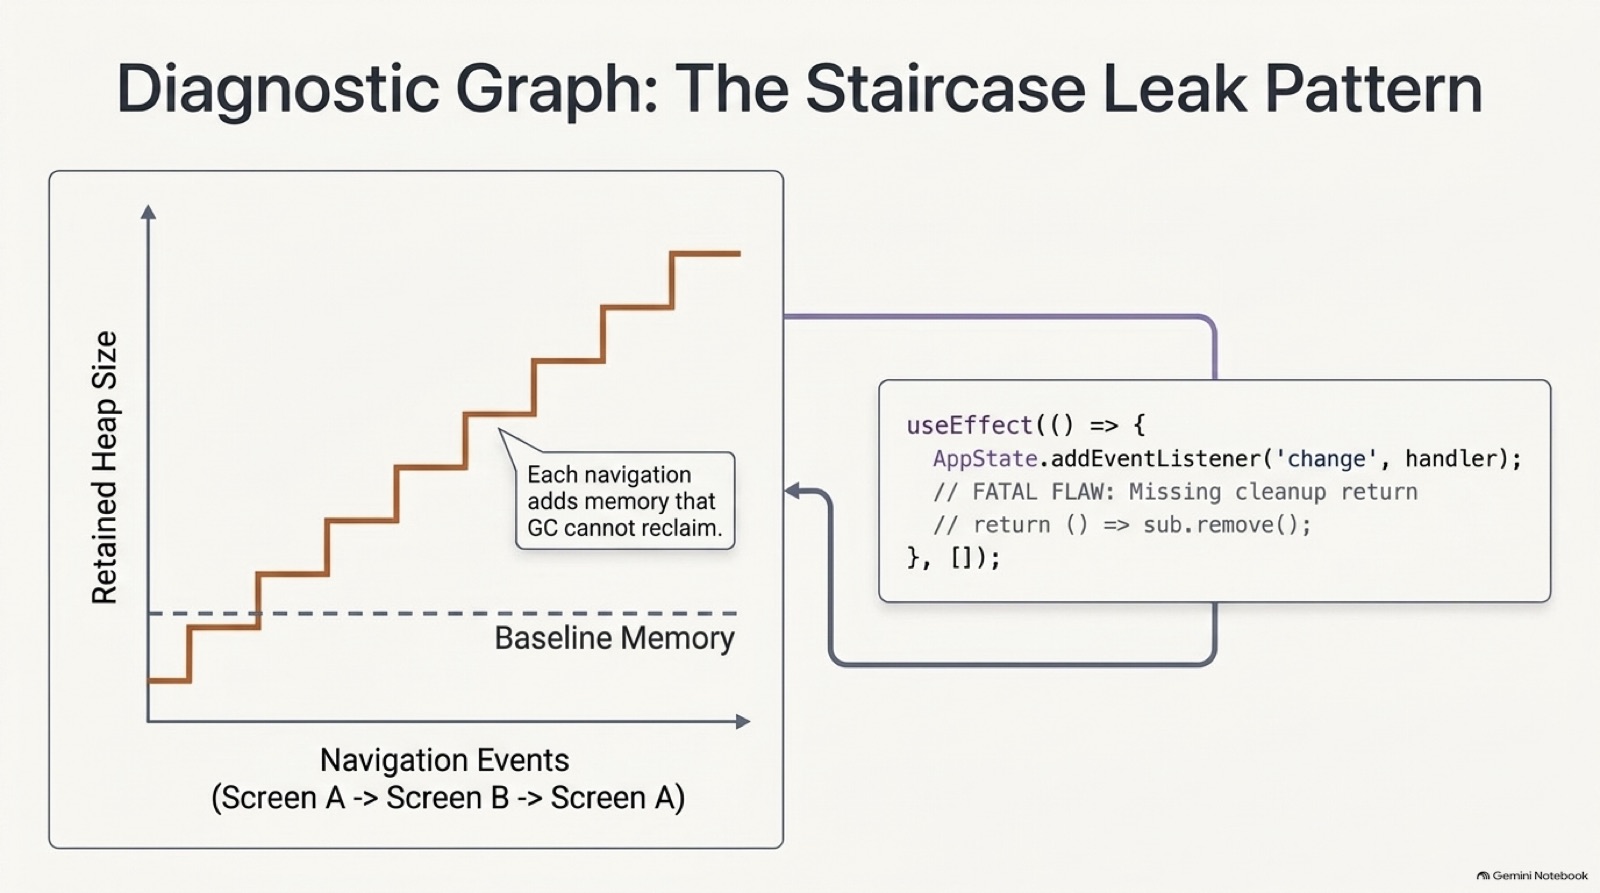
Memory after forced garbage collection that rises by a fixed amount per screen visit. It is the pattern of a leak.
A context that lives as long as the app. Use it for work that doesn't need a screen, and don't hold an Activity for it.
Memory that garbage collection cannot reclaim because something still points at it. A staircase is the retained heap growing with each visit.
A long-lived object, such as a global event registry, that holds a reference. Everything reachable from it stays alive until the anchor lets go.
Components that have unmounted but are still referenced by a closure. A heap snapshot shows them as detached trees that should not exist.
Question
What exactly you must answer, and what to settle before you start.
2.1Question
Crash reports show out-of-memory crashes after about ten minutes of use on mid-range Android. Find the leak and prove it is fixed.
2.2Clarify first
Each answer removes a guess.
| You ask | Answer |
|---|---|
| Which screens do users cycle through? | A list, a detail screen and a map, repeatedly. |
| Does memory drop after leaving a screen? | Not fully, and it never returns to the starting level. |
Detailed answer
How it works, and how to build or explain it.
3.1The picture
Drawn for this page, at a size that reads on a phone.
3.2Step by step
The mechanism, in the order you would explain it.
- Reproduce with a script
Open and close the suspect screen many times, forcing a garbage collection after each visit, and record memory.
- Read the staircase
Flat after warm-up means no leak. A steady rise per visit means something stays alive. The code below computes the slope.
- Find the heap
Take a Hermes heap snapshot to look for retained JavaScript objects. Use Android Studio's profiler or Xcode Instruments for native ones.
- Follow the retaining path
Look for the listener, timer or static reference that holds the screen. The snapshot's retainer view shows it.
- Fix with cleanup
Return a cleanup function from every effect that subscribes. Cancel timers and requests. In native code, hold an Activity weakly, or use the application context.
- Lock it in
Add the staircase script to CI for the riskiest screens, and track out-of-memory crash rate in production.
3.3Which layer, which tool
| Layer | Typical symptom | Tool |
|---|---|---|
| JavaScript heap | Listeners and state pile up | Hermes heap snapshots in your React Native debugger |
| Native heap | Screens that never deallocate | Android Studio Memory Profiler, Xcode Instruments Leaks |
| JSI boundary | Callbacks and host objects still referenced | Retaining paths in a heap dump |
| Production | Out-of-memory crash rate | Crashlytics or Sentry |
| Native module on Android | Activity kept alive after rotation or back | Memory Profiler: filter by Activity, then read retained size |
| iOS objects | Counts that do not return to the pre-navigation level | Instruments: Leaks, and allocations compared by generation |
3.4Code
Working code for the core of it.
Finding a staircase, and a listener that never leaves
Memory that rises with each visit to a screen is the mark of a leak. This turns samples into a slope, and shows the listener bug behind many of them.
1/* Finding leaks the way the profiler shows them: memory that climbs one step per screen visit. */2 3/** Least-squares slope of memory against visit number, in MB per visit. */4export function leakSlope(samplesMb: number[]): number {5 const n = samplesMb.length;6 if (n < 2) return 0;7 const meanX = (n - 1) / 2;8 const meanY = samplesMb.reduce((a, b) => a + b, 0) / n;9 let num = 0;10 let den = 0;11 samplesMb.forEach((y, x) => {12 num += (x - meanX) * (y - meanY);13 den += (x - meanX) ** 2;14 });15 return num / den;16}17 18/**19 * Samples are taken after forcing a garbage collection, once per visit. The first visits are warm-up:20 * caches fill and then stop growing, so they are skipped.21 */22export function judgeLeak(samplesMb: number[], opts = { warmup: 2, minVisits: 8, maxMbPerVisit: 0.5 }) {23 const usable = samplesMb.slice(opts.warmup);24 if (usable.length < opts.minVisits) return { leaking: false, slope: 0, verdict: `need ${opts.minVisits} visits after warm-up, got ${usable.length}` };25 const slope = leakSlope(usable);26 const leaking = slope > opts.maxMbPerVisit;27 return { leaking, slope, verdict: leaking ? `grows ${slope.toFixed(2)} MB per visit` : "flat" };28}29 30/** A stand-in for DeviceEventEmitter, so the listener count can be read. */31export class EventHub {32 private listeners = new Map<string, Set<(data: unknown) => void>>();33 on(event: string, fn: (data: unknown) => void) {34 if (!this.listeners.has(event)) this.listeners.set(event, new Set());35 this.listeners.get(event)!.add(fn);36 return { remove: () => this.listeners.get(event)?.delete(fn) };37 }38 emit(event: string, data: unknown) {39 this.listeners.get(event)?.forEach((fn) => fn(data));40 }41 count(event: string) {42 return this.listeners.get(event)?.size ?? 0;43 }44}45 46/** One visit to a screen. Without cleanup, each visit leaves a listener, and its closure, behind. */47export function visitScreen(hub: EventHub, withCleanup: boolean): () => void {48 const subscription = hub.on("sync", () => {});49 return () => {50 if (withCleanup) subscription.remove();51 };52}samplesMb.slice(opts.warmup)- Caches fill during the first visits. Skipping them stops normal warm-up looking like a leak.
slope > opts.maxMbPerVisit- A steady rise per visit is the signal. Your own limit, from your baseline, goes here.
minVisits- Too few visits can't separate a trend from noise, so the answer is 'not enough data'.
if (withCleanup) subscription.remove()- The leak in one line: without removal, each visit leaves a listener and everything its closure captures.
Tested by npm run test:modules.
3.5Slides
From the source decks this page draws on. Swipe, use the arrows, or press the left and right keys. Notes flag where a slide's numbers or flow differ from this page.
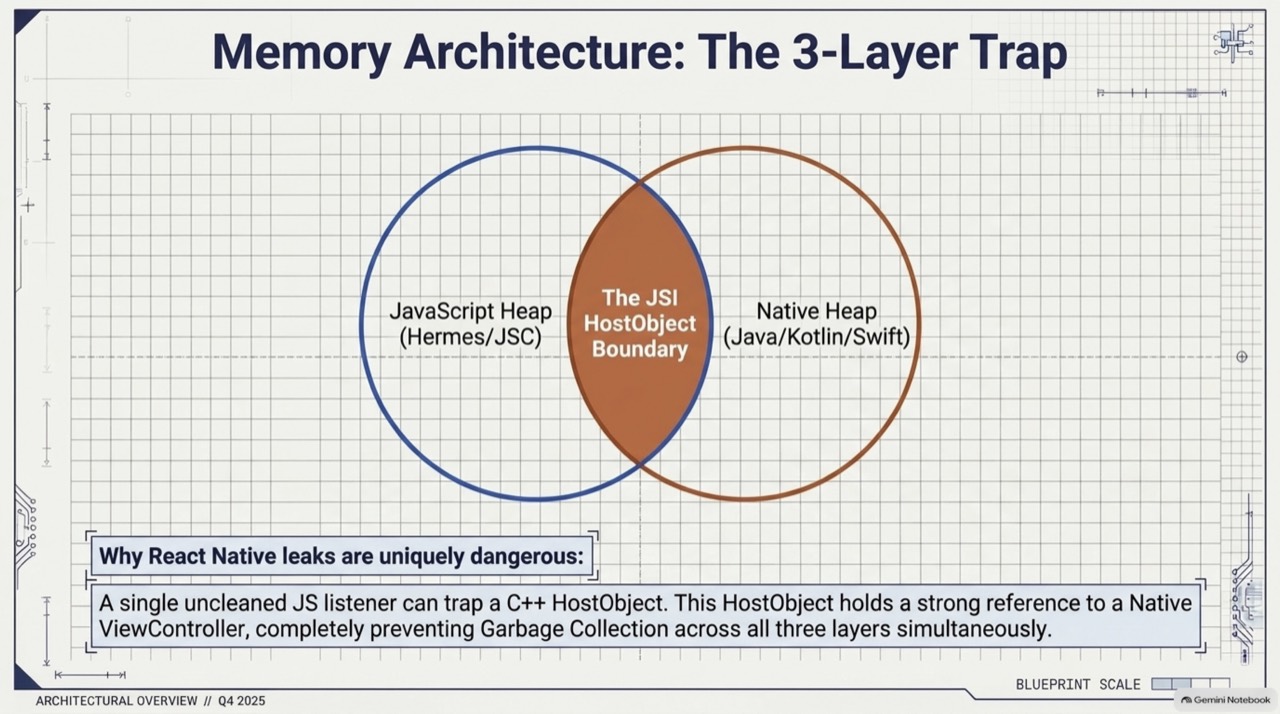 ‹›
Why a leak crosses all three layers.Slide figures about growth per navigation differ between decks. Use your own slope.
- Why a leak crosses all three layers.
- How an uncleaned listener turns into an out-of-memory crash.
- The three layers of memory in one picture.
- Which tool finds a leak in which layer.
- The staircase pattern, and the tools that confirm it.
- Background tasks leak the same ways, and the cleanup is the same.
- Each thread owns a different kind of memory.
- How one uncleaned subscription anchors a whole component graph.
- The same leak across the native and JSI boundaries.
- Which profiler reads which heap, and what to look for.
- Three heaps, three causes, three tools.
- The staircase, and the effect with no cleanup that draws it.








Q&A
What interviewers ask next. Answer out loud, then open.
4.1Interview questions
Why force a garbage collection before sampling?
Why skip the first visits?
Why is a leak worse here than in a pure native app?
Activity context or application context?
What is the bug in an effect that calls AppState.addEventListener with no return?
How many navigation cycles make a good leak test?
How can a promise leak across the JSI boundary?
Why is a WeakReference only a partial fix for Activity leaks?
Extra depth
Edge cases, counterpoints and what to read next.
5.1Edge cases and counterpoints
Includes the strongest argument against this approach.
Show detailsHide details
- Numbers in the wild
- Figures like '10 MB per navigation' appear in articles, and they differ between sources. Your own slope is the only one that counts.
- Images
- Large bitmaps leak memory without a leak. Size images to their display size and cache by size.
- Counterpoint
- Not every rise is a leak. A bounded cache grows to its limit and stops, which the flat part after warm-up shows.
- Debugger names change
- Older guides name Flipper as the heap tool. Current React Native versions use React Native DevTools and the Hermes profiler, so follow your version's documentation.